These days product data is everywhere. Everyone seems to collect it, have a lot of it, but the question remains; how exactly can you ensure your organization’s product data is being put to good use?
It’s time to take your product development one step further by providing role-based data access, connecting your enterprise systems, and learning how to make the most of your product data. I am going to explain exactly how easy that is to do.
The current state of product data
Companies today have many different roles that require access to product data. This may include people outside of the typical roles of which you may be thinking.
Departments such as engineering, manufacturing, that’s a given, but expand your thinking to include operations, purchasing, and marketing. They all need data access in order to edit and consume information. Think about sourcing…I’ll stop there, but you get the idea.
Let’s focus on the engineering department for a moment.
People could be involved from the mechanical side, the electrical side, or even a quality standpoint. Beyond that, people need to either contribute or consume information that could include manufacturing, service, sales, and more.
Product data game-changers
Product data silos limit productivity – PTC & EAC have the answer.
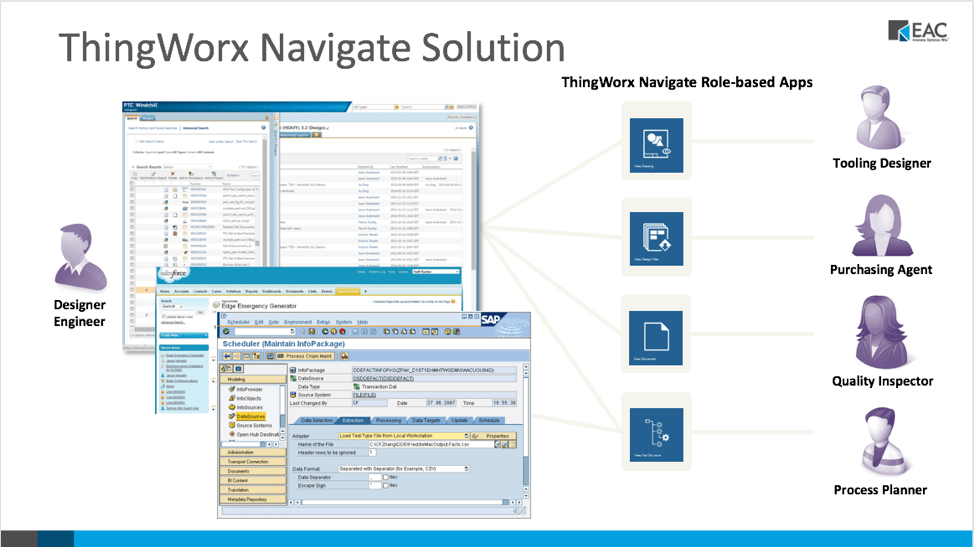
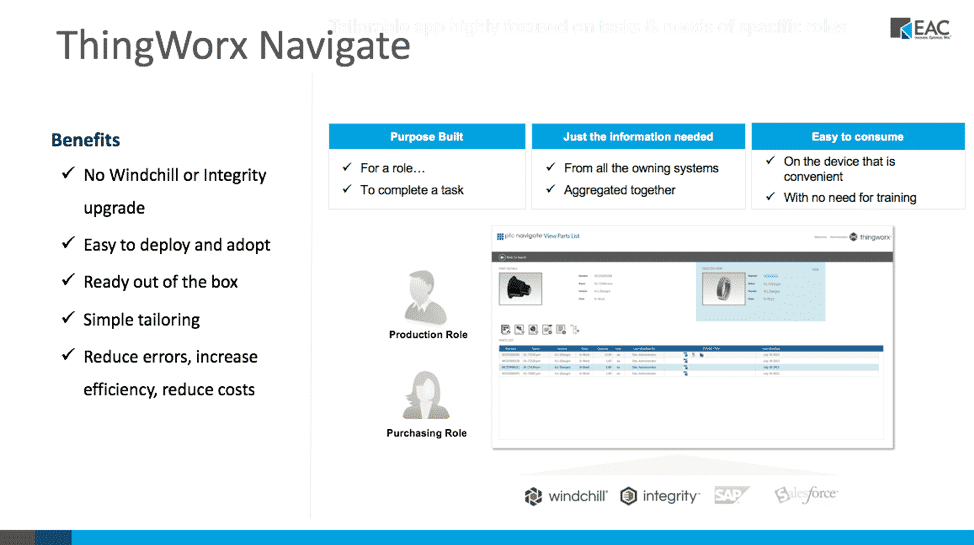
PTC ThingWorx Navigate was designed to address data accessibility problems by providing simple role-based apps that deliver just the right information to different groups (or departments) in the way that they need
When non-engineering colleagues need access to vital information, they typically interrupt an engineer or designer with a request. ThingWorx Navigate eliminates that distraction and “double-billing.” Through role or task-based self-service applications, data can be securely shared with a team. That way non-expert teams can use a simplified user interface to access the product data they need, right when they need it.
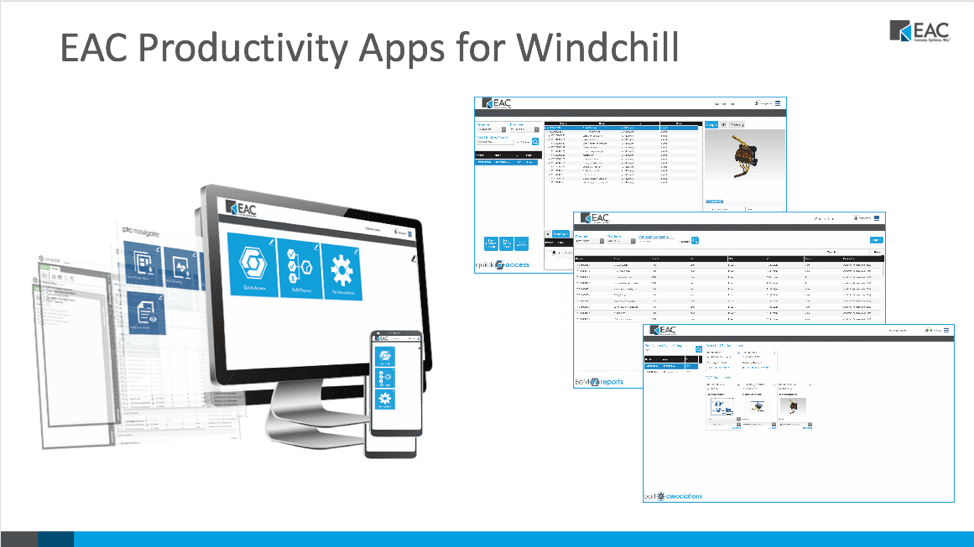
To help accelerate product development processes and take product data even further, our company (EAC Product Development Solutions) has also created what we call EAC Productivity Apps that work alongside ThingWorx Navigate apps.
So what’s the difference between ThingWorx, ThingWorx Navigate and our EAC Productivity apps?
This is a great question- I am going to try and paint the picture for you.
First, it’s important that you understand what ThingWorx is and how it is different from ThingWorx Navigate.
ThingWorx is the proper name of PTC’s Internet of Things (IoT) platform comprised of 5 components; foundation, industrial connectivity, analytics, studio,
The foundation component is the heart of the ThingWorx loT platform used to make connections to ‘things’ which could be machines, products or software systems or pretty much anything with an IP address and a communications interface.
User interfaces to the data coming from these connections are displayed on websites called ‘mashups,’ created with ThingWorx foundation. You might know these perhaps as ‘data mashups’ or possibly as ‘data dashboards’. Simply put, Thingworx is the IoT platform that makes everything possible. (Here’s exactly what makes Thingworx the leading technology for industrial IoT)
Then you have ThingWorx Navigate.
ThingWorx Navigate is the proper name of PTC’s applications that
ThingWorx Navigate Apps use a Windchill (PLM) connector to extract product data for presentation to Windchill Product Lifecycle Management users.
Fundamentally, ThingWorx Navigate Apps are all simply data and product information mashups created with ThingWorx. With ThingWorx Navigate you receive out-of-the-box apps that are instantly ready to be used with your PLM system. The idea behind these product lifecycle management apps is to ensure users can capture the complete functionality of their PLM (product lifecycle management) investment.
ThingWorx Navigate PLM Apps include:
View Design Files – A design file would be a format of a file that isn’t the native CAD format. This could be a staph or Induce or perhaps a 3D PDF
View Drawing – Allows you to look at just drawings. This application pulls drawings from your Windchill PLM system.
View Part Properties – This feature allows you to look at part properties- as if you were hitting the ‘Information button’ next to a file.
View Parts List – Allows you to look at bills of Materials (BOMs)
View Part Structure– With the View Part Structure App, ThingWorx is actually going into PDMLink and showing different aspects of a specific part instead of different ways of going at it (such as having to open several different tabs to get information). Using this application, you can get all your information together on one page. This feature also includes capabilities that cross-highlight part structures within your product. For instance, you could select a component and it would highlight that part and create a hyperlink that allows you to directly look at that specific part. This feature essentially creates a mash-up that takes information from different places inside of Windchill PDMLink and brings them together putting them on one screen, allowing you to have all your information at your fingertips.
View Document & View Document Structure
If you would like to learn more about ThingWorx Navigate technology or if you have any questions, you can always request to talk with Thingworx Navigate specialists here.
PLM Applications created by EAC
Our EAC Productivity Apps (also known as product lifecycle applications)
They allow departments to access content and perform common tasks through a very simple interface, versus having to use a complex product lifecycle management system (PLM) or Enterprise Resource Planning (ERP) system.
PTC Navigate Apps vs. EAC Productivity Apps
Our EAC Productivity Apps provide capabilities beyond that of the out of the box ThingWorx Navigate apps.
In short, ThingWorx Navigate applications allow you to securely access and present role-specific data from your Windchill system. They provide all of the power of a Product Lifecycle Management (PLM) system to someone who is not familiar with its ins-and-outs of product data management.
EAC Productivity Apps take it a step further by taking the underlying technology of ThingWorx Navigate, and the ability to get at the information in the PLM system and create even more complete applications that really give individuals instantaneous access to the information and product data they need to do their job. EAC’s PLM applications are created using PTC’s ThingWorx IoT platform, however, they can run independently of ThingWorx Navigate.
These apps are unique to EAC.
While built using the same ThingWorx foundation, ADK and [Windchill connector], they have their own look, feel and functionality. These mashups are packaged and sold together as a collection. EAC Productivity Apps created for Windchill promote user adoption and amplify the return on the investment you’ve made in your Windchill system, as well as extending role-based visibility into relevant product data and the impact PLM has on your organization.
Take your product data further with EAC Productivity Apps
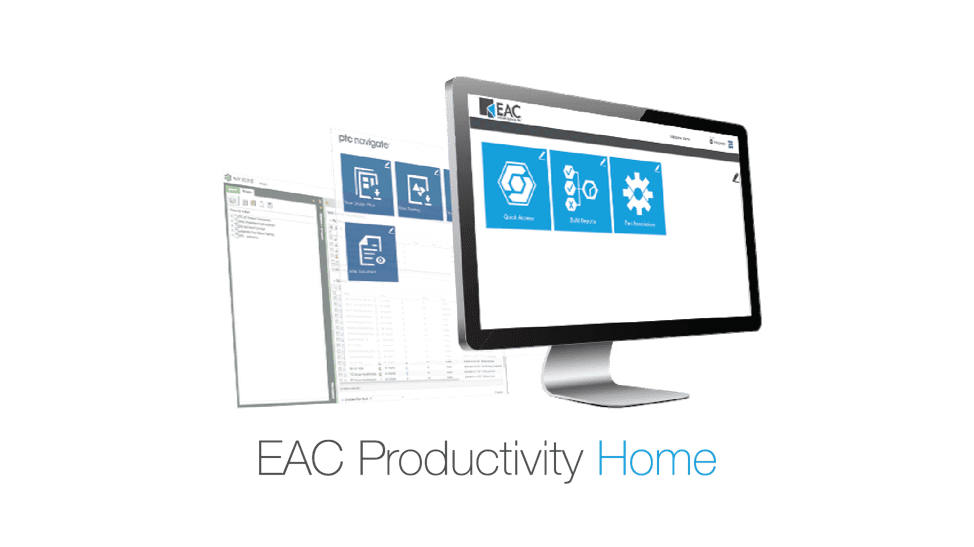
Every subscription of EAC Productivity Apps includes free access to EAC Productivity Home. EAC Productivity Home is a proprietary framework, or launcher, for ThingWorx Navigate applications.
It sits on top of Windchill and
The EAC Productivity App, Quick Search, provides a simple way for users to find content in Windchill. It removes the need for users to apply an understanding of how Windchill objects are related in order to find the information needed to do their job.
The Quick Search PLM application also allows users to search for components and retrieve information and file formats. For instance, if you were to grab a drive system and do a quick search, it’s going to find product information such as parts, EMP like documents, CAD files and more. See EAC Productivity Application Quick Search in action here.
You can also learn more about the Quick Search features in this brochure.
The Quick Access EAC Productivity Application streamlines access to critical and select data sets. Simplifies downstream users feeding critical quality information back to engineering with minimal effort.
This EAC Productivity App allows downstream users to feed critical quality information back to engineering with minimal effort. The simplified interface and consolidated task workflows help users easily submit new problem reports, new change requests, and new variances.
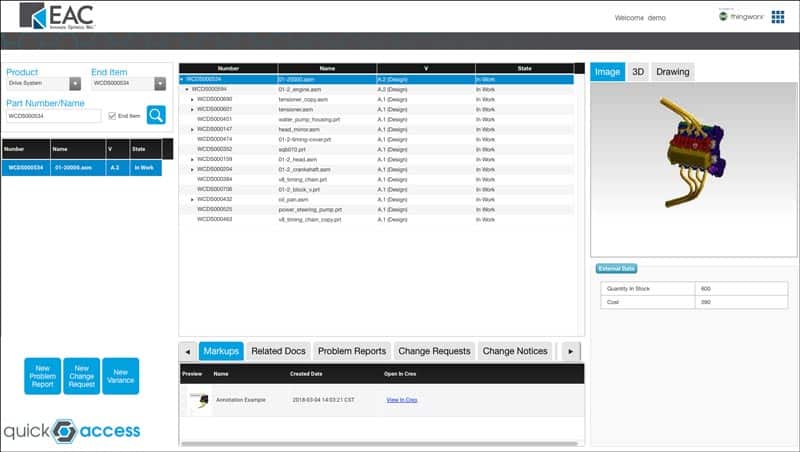
For instance, you could select a component (such as a product), pick its name (the end item number), search for it, and you would get straight to assemblies. With the use of Quick Access users can easily submit new problem reports, change requests, variances and more.
You can learn more about Quick Access features in this brochure.
The Part Associations EAC application provides a “shortcut” for non-CAD users to access critical files and documentation associated with designs like drawings, parts, assemblies, and other documents associated with CAD files and part data.
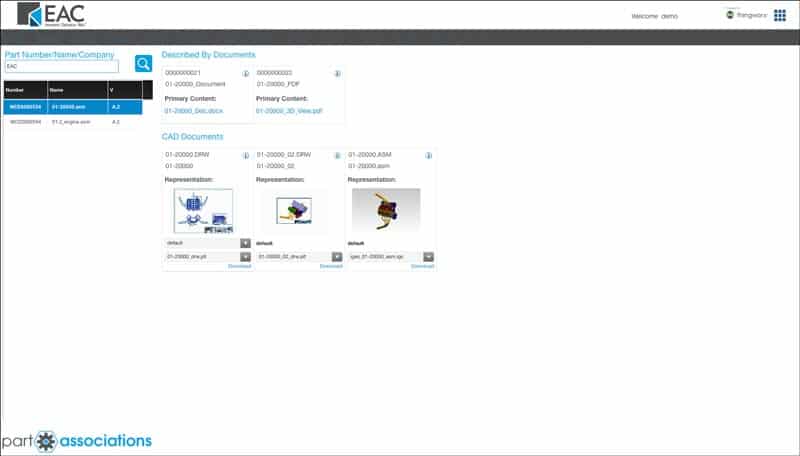
You can learn more about Part Association features in this brochure.
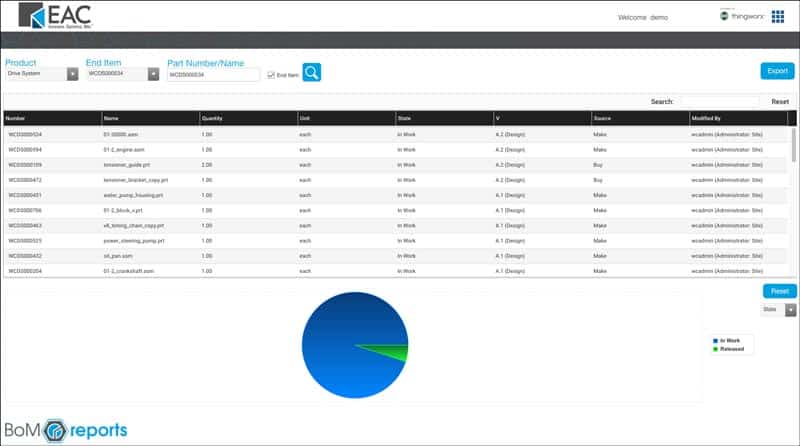
BoM Reports App provides a visual representation of cost
This EAC Productivity App allows users to quickly assess a Bill of Material and ensure projects stay on-time and on-track. The simplified view helps ensure products are built with the appropriate design iterations. With the use of BoM Reports users can easily see BoMs, lists of unreleased parts, parts that have been created or modified by specific users and more.
This app allows users to see the progress of a bill of materials, and apply filters to focus on parts that are not yet released. It is also useful for viewing all of the “make” parts or “buy” parts in a given BoM, or all parts created/modified by a particular user.
Get better access to your product data
See all the features of EAC P
Smart connected operations are transforming companies and changing the way we do business.
Imagine if your company was able to take advantage of data that revealed existing and future problems, and allowed your team to make drastic improvements by completing predictive maintenance and service.
Business decisions can no longer be reactive. You need to be proactive — Here’s how smart connected operations could ‘revolutionize’ the way you do business.
Smart connected operations help businesses make faster decisions
What helps a company make fast, highly informed decisions? Data.
Smart connected operations allow information to be collected from multiple sources, assets, facilities, and even vendors. This connectivity allows data to be collected and analyzed to inform decision-making and enable teams to make faster decisions.
Smart connected operations help businesses increase operational performance
Smart connected operations can help your business monitor and track asset viability, ultimately allowing your company to reduce downtime, improve design, and improve utilization.
Data from connected assets, in collaboration with other enterprise systems, can provide not previously possible visibility and automation across organizations.
For example, product data flowing through a CRM system can also be sent to billing or into a supply chain management system— helping to eliminate error-prone manual steps and providing new sales opportunities for things such as consumable replenishment or warranty renewals. (PTC)
Smart connected operations help businesses decrease lead time and increase product quality
The insight smart connected operations provide will help you improve and perfect your production processes.
By integrating smart technologies and processes, your organization can lower development costs, time-to-market, and improve your overall product quality.
Smart connected operations help businesses improve manufacturing responsiveness
A sensorized manufacturing floor let’s you monitor performance, in real-time, and provide valuable information to field service technicians and manufacturing floor managers.
Service responsiveness will be accelerated with remote monitoring, access, and complete management of your disparate systems through enabling smart connected operations within manufacturing.
Smart connected operations help businesses improve supply chain coordination
The new capabilities of smart, connected operations will alter every activity in the supply chain.
Your operational efficiency will increase exponentially if your organization reaps the benefits of integrating with other data, such as inventory locations, traffic patterns, commodity prices, and historical data repositories.
Smart connected operations help businesses reduce manufacturing IT costs
Smart connected operations use digital interfaces that make it easier and less expensive to track the production process. These interfaces are less costly to apply and easier to modify than physical system controls. By integrating smart connected operations, your company will increase operation mobility, which in turn can reduce your manufacturing IT costs.
The sensors in smart connected operations also identify a need for service before the machine or product fails. These data analytics will drive previously unattainable efficiency improvements by providing predictive maintenance analytics and higher productivity levels.
With the help of predictive analytics, smart connected operations help organizations anticipate problems and take early action.
For example, your industrial machines would be remotely monitored and adjusted by end users during and beyond operation hours. They could even begin to manage themselves leveraging machine learning and predictive analytic engines.
The bottom line is that smart connected operations have begun to change business models, organizational structure, and manufacturing system architecture.
The development and the deployment of smart connected operations will be incremental, but the opportunity is here today.
What are you waiting for? It’s time to start capturing the time, dollars, production, and quality that smart connected operations can provide.
